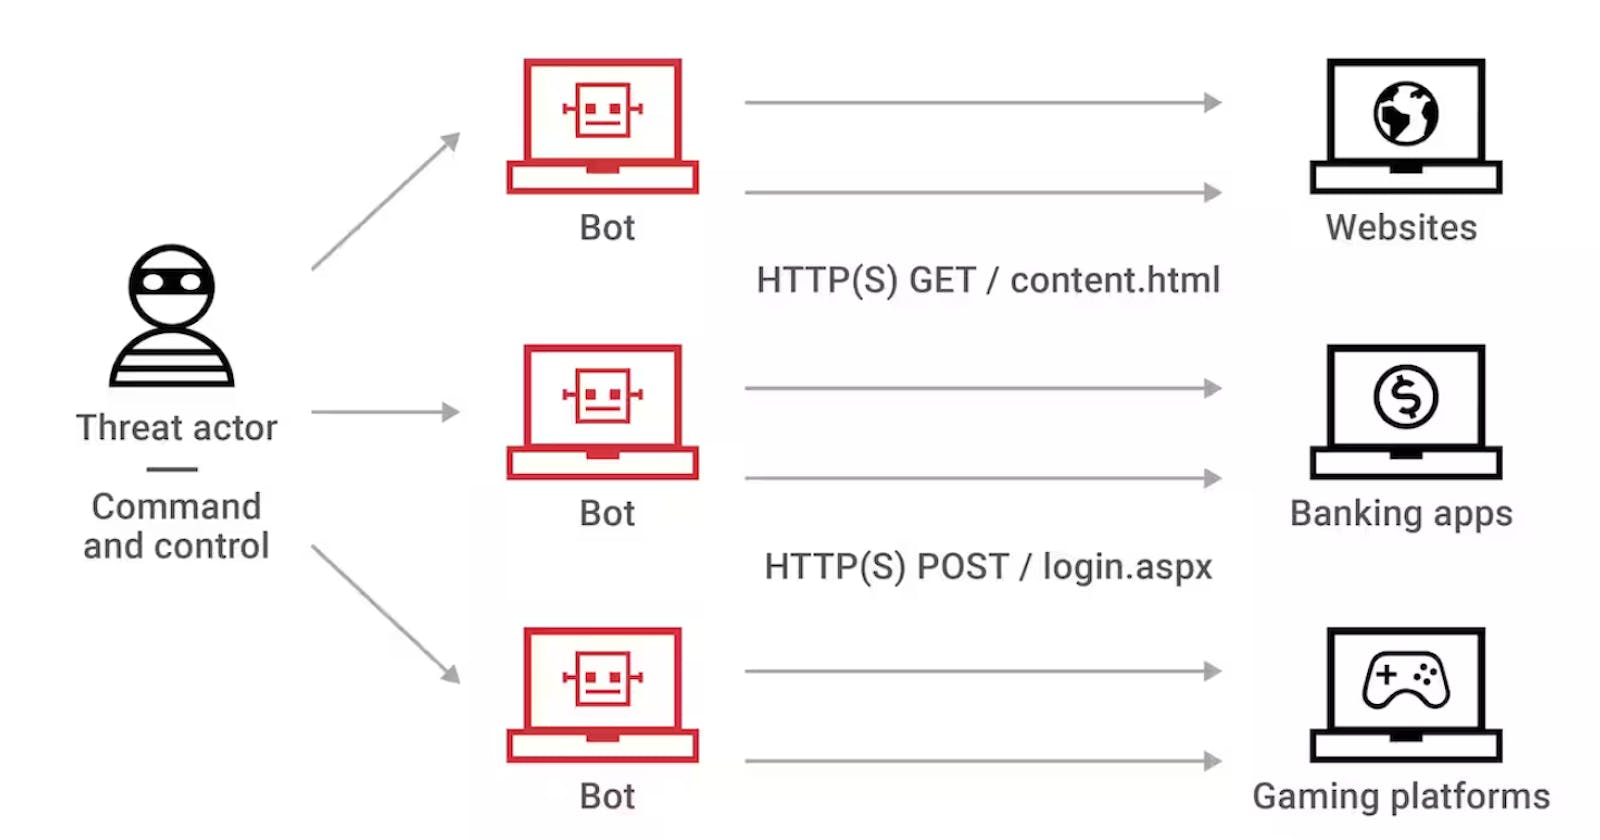
In this small post I would like to show a few useful commands to use if someone is experiencing a DDoS attack. In my case, there is an nginx as a front-end server. The access log format looks like this:
log_format main '$remote_addr — $remote_user [$time_local] "$host" "$request" '
'$status $body_bytes_sent "$http_referer" '
'"$http_user_agent" "$http_x_forwarded_for" -> $upstream_response_time';
In the log file we’ll see something like this:
188.142.8.61 — - [14/Sep/2014:22:51:03 +0400] «mysite.com» «GET / HTTP/1.1» 200 519 «kiloccnp.com.vn» «Mozilla/4.0 (compatible; MSIE 8.0; Windows NT 5.1; WOW64; Trident/4.0; SLCC2; .NET CLR 2.0.191602; .NET CLR 3.5.191602; .NET CLR 3.0.191602» "-" -> 0.003
Analyzing DDoS Attack
tail -f /var/log/nginx/nginx.access.log | cut -d ' ' -f 1 | logtop
This command allows to see a bigger picture: the distribution of unique IPs sending requests, the number of requests from one IP, etc.
The main thing here is that all of this operates in real-time and we can monitor the situation, as well as make necessary changes in the configuration. For example, we can ban the top 20 of the most active IPs via iptables, or limit the geography of requests for some time in nginx with the help of GeoIP ([nginx.org/en/docs/http/ngx_http_geoip_modul..).
Once](nginx.org/en/docs/http/ngx_http_geoip_modul..).Once) you run the command, it will display (and will update in real-time) something like the following:
3199 elements in 27 seconds (118.48 elements/s)
1 337 12.48/s 95.65.66.183
2 308 11.41/s 122.29.177.10
3 304 11.26/s 122.18.251.54
4 284 10.52/s 92.98.80.164
5 275 10.19/s 188.239.14.134
6 275 10.19/s 201.87.32.17
7 270 10.00/s 112.185.132.118
8 230 8.52/s 200.77.195.44
9 182 6.74/s 177.35.100.49
10 172 6.37/s 177.34.181.245
In the given case, the columns mean:
1 — the sequence number
2 — the number of requests from the given IP
3 — the number of requests per second from the given IP
4 — the IP itself
At the very top you will see the summery for all of the requests. We can see that IP 95.65.66.183 sends 12,48 requests per second. During the last 27 seconds it has sent 337 requests.
Let’s review it in details:
tail -f /var/log/nginx/nginx.access.log — continuously read the end of the log-file.
cut -d ' ' -f 1 — split the string into “substrings” with the help of a delimiter that is defined in –d flag (in the given case, it’s a space).
-f 1 flag means that we only want to show the field with “1” as a sequence number only (in the given case, the field will contain the IP address sending a request).
logtop counts the number of equal strings (i.e., IPs), sorts them in descending order and prints to screen in the form of a list, adding statistics at the same time (in Debian we can do it via aptitude from a standard repository).
grep "&key=" /var/log/nginx/nginx.access.log | cut -d ' ' -f 1 | sort | uniq -c | sort -n | tail -n 30
That will show the distribution of a string by the IP in the log.
In my case, we were to gather the statistics regarding one IP using the &key=… parameter in a request.
We are going to see something of the kind:
31 66.249.69.246
47 66.249.69.15
51 66.249.69.46
53 66.249.69.30
803 66.249.64.33
822 66.249.64.25
912 66.249.64.29
1856 66.249.64.90
1867 66.249.64.82
1878 66.249.64.86
1st column is the number of string entries (IP in our case)
2nd column is the IP address itself
We can see that IP 66.249.64.86 has sent 1,878 requests (Later we will see in Whois that this IP belongs to Google and is not “harmful”)
Let’s take a closer look at it:
grep "&key=" /var/log/nginx/nginx.access.log we find all the strings in the log that contain "&key=" substring (no matter in what part of the string it’s located)
cut -d ' ' -f 1 (see the previous example) derive an IP address
sort — sort lines (it’s necessary for the correct operation of the next command)
uniq -c — show unique lines and count the number of times the line occurred in the input (-c flag)
sort -n - sort by comparing according to string numerical value (-n flag)
tail -n 30 — derive the last 30 lines (-n 30 flag; we can define a random number of lines)
All the mentioned above requests are provided for Debian and Ubuntu, but I think the commands will look pretty much the same in other Linux distros.
